

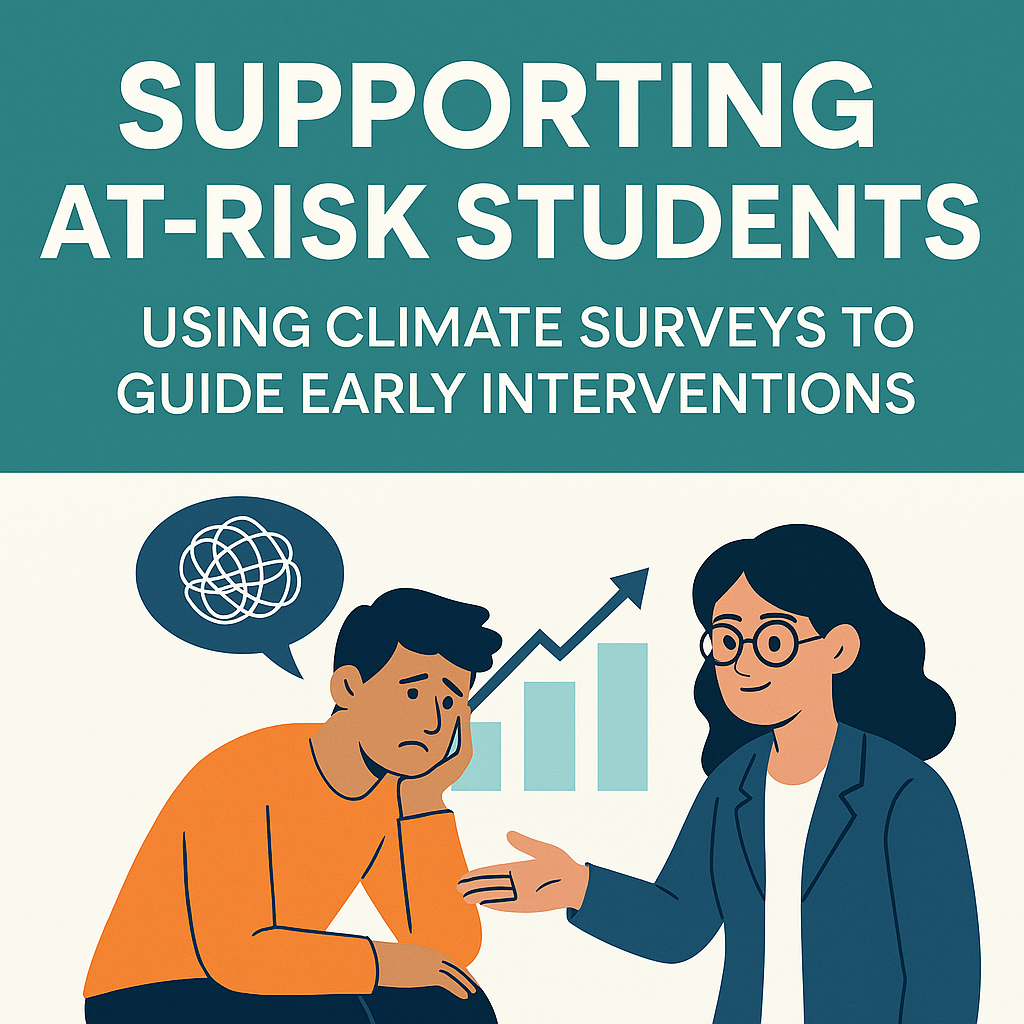
Learn how to use campus climate survey data to identify and support at-risk students facing challenges with connection, safety, or mental health.
When students leave college, it rarely happens overnight.
More often, it begins with a quiet unraveling:
They stop going to club meetings.
They disengage in class.
They feel out of place, unsupported, or invisible.
By the time they visit the registrar’s office or disappear entirely, the window for effective intervention has closed.


This is why climate surveys matter—not just as research tools, but as early detection systems. When designed and analyzed with intention, campus climate surveys can help higher education leaders spot at-risk students long before they fall through the cracks.
Here’s how to turn your survey into a student success engine—one that identifies vulnerable populations and guides your support efforts where they’re needed most.
Step 1: Know What You’re Looking For
Before diving into survey results, define what risk looks like on your campus. While traditional indicators like GPA and financial hardship are well-tracked, climate surveys can uncover less visible risks such as:
- Low sense of belonging
- Lack of trust in campus support systems
- Unsafe or discriminatory experiences
- Poor mental health and emotional well-being
- Social isolation and disengagement
These psychosocial factors often emerge before academic decline, and they’re usually best revealed through climate feedback.
Step 2: Build or Customize Survey Items That Surface Risk
Design survey questions to get at the heart of student experience, not just satisfaction.
Examples of data-rich items:
- “I feel a sense of belonging on this campus.”
- “There is at least one adult on campus I can talk to when I need support.”
- “I feel emotionally safe in campus spaces.”
- “I often feel isolated or disconnected from my peers.”
- “I know how to access mental health resources if I need them.”
Pro Tip: Include open-ended response options. Students often reveal why they’re struggling in their own words, providing rich context for your next steps.
Step 3: Use Filters to Find Vulnerable Populations
Using tools like Viewfinder®’s Custom Dynamic Dashboards, you can filter responses by key demographics or identities to uncover disparities.
Look for patterns by:
- Race and ethnicity
- First-generation status
- LGBTQ+ identity
- Disability
- Transfer or commuter status
- Class year (especially first-year students)
For example:
If 80% of your student body reports a strong sense of belonging—but only 46% of first-gen students say the same—that’s a red flag.
These filters transform your survey from a generic report card into a targeted, equity-driven strategy tool.
Step 4: Spot Clusters of Risk Indicators
One low score doesn’t always equal risk, but a pattern of concerns across multiple areas likely does.
Pay attention to students (or student groups) who:
- Report low belonging and low emotional safety
- Feel disconnected from faculty and peers
- Are unaware of resources and feel uncomfortable seeking help
This cluster analysis approach helps you triage who needs urgent support.
Step 5: Collaborate With Student Support Services
Climate survey insights become truly powerful when shared across campus units that serve students most directly:
- Student Affairs can launch peer mentorships or inclusion campaigns
- Counseling Centers can scale outreach to high-risk populations
- Academic Advisors can follow up with students flagged in both academic and climate surveys
- Diversity and Inclusion teams can host affinity group forums tied to specific concerns
The more integrated your response, the more likely students will feel supported from multiple touchpoints.
Step 6: Communicate What You’ve Learned—and What You’re Doing
Closing the feedback loop builds trust. It tells students: we heard you, and we’re acting on it.
Share:
- Key findings (in digestible formats—infographics, social posts, town halls)
- Programs, events, or policy changes created in response
- Opportunities for continued feedback and involvement
This is where intervention becomes prevention.
Final Thoughts: Using Data to Show Students They Matter
Not every student will knock on your door and ask for help. But through climate surveys, they’re telling you what they need—often in clear, consistent ways.
The question isn’t whether the data exists. The question is whether we’re listening.
By analyzing and acting on climate survey results with care, higher education leaders can:
✔️ Improve student retention
✔️ Advance equity
✔️ Foster a campus where students feel safe, connected, and capable of thriving
Ready to turn your campus climate survey into a powerful tool for student success?
Download the Climate Survey Success Kit for templates, dashboards, and strategies designed to help you identify and support at-risk students before it’s too late.